3.4
Introduction to Matrices:
This branch of mathematics is useful in the study of
Science, Engineering, Economics and other fields.
The 11 railway connections between cities of Karnataka,
Maharashtra and
|
No |
Starting
place |
Destination |
|
1 |
Mangaluru |
Mumbai |
|
2 |
Mangaluru |
Pune |
|
3 |
Hubballi |
Pune |
|
4 |
Belagavi |
Nagapura |
|
5 |
Mumbai |
|
|
6 |
Mumbai |
|
|
7 |
Pune |
|
|
8 |
Pune |
|
|
9 |
Pune |
Vadodara |
|
10 |
Nagapura |
|
|
11 |
Nagapura |
Vadodara |
Can you tell quickly the number of direct connection
between Mangaluru and
We will solve this problem in chapter 3.6
Let us read the following paragraph.
On Monday the attendance in your class was 30 girls and 22
boys and seven were absent. On Tuesday the attendance was 28 girls and 26 boys
and 5 were absent. On Wednesday the attendance was 26 boys and 27 girls and six
were absent. Thursday was a republic day and there were no classes. On Friday
the attendance was 30 boys and 23 girls and six were absent. On Saturday the
attendance was 34 boys and 24 girls and one was absent.
From the above data can you easily answer following
questions?
1. Which day had maximum attendance?
2. Which day had maximum absentees?
3. On which day girls’ attendance was more than boys?
4. For how many days was girls’ attendance more than boys?
Since the data was in narration form, it was not that easy
to answer these questions. Let us represent the data in a tabular form as shown
below:
A= 
|
In this
representation 1. The
numbers in six horizontal rows represent attendance details for a week from
Monday to Saturday. 2. The
numbers in the first vertical column represent the attendance of girls for
six days. 3. The
numbers in the second vertical column represent the attendance of boys for
six days. 4. The
numbers in the third vertical column represent the number of absentees for
six days. With
the above representation, we can easily answer the questions: 1.
Saturday had maximum attendance (only one student was absent) 2.
Monday had maximum absentees (7) 3.
Monday had maximum attendance of girls 4. On
three days (Monday, Tuesday and Wednesday) attendance of girls was more than
that of boys |
|
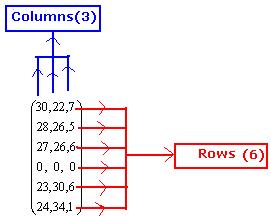
Definition : A ‘matrix’ is a rectangular representation of data
in rows and columns, normally enclosed
within brackets.
|
Definitions: Each number or entity in a matrix is called ‘element’ The
horizontal representations are called ‘rows’. The
vertical representations are called ‘columns’. In the Attendance
example discussed above, Matrix A has 6 rows and 3 columns. It is called a 6 by
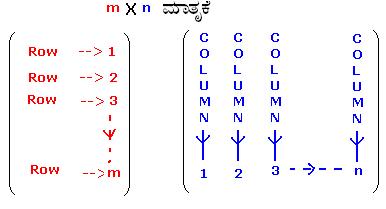
3 (6X3) matrix. The order of a matrix is denoted by (m x n),
where m is number of rows and n is number of columns in the matrix. |
|
|
In the
adjacent Matrix B, the four sets of row elements
are(p1,p2,p3),(q1,q2,q3),(r1,r2,r3) and(s1,s2,s3). The
three sets of column elements are (p1,q1,r1,s1),(p2,q2,r2,s2)
and(p3,q3,r3,s3). Thus
matrix B has 4 rows and 3 columns and hence is a 4 by
3 (4X3) Matrix. |
B= |

3.4 Summary of learning
|
No |
Points
studied |
|
1 |
Definition
of matrix, rows, columns, order |