5.3 Mean, Median and Mode for ungrouped
data:
You must have heard your teachers
saying that the average number of students in a class in their school is 45.
What does it mean?
Normally a school has several
sections for a particular standard (Ex: Sections A, B and C in 8th
standard). Most of the times,all the sections in a school will not have same
number of students.
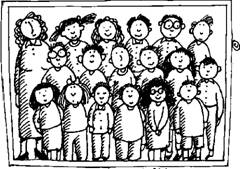


Class A Class
B Class C
5.3 Example 1: In the above picture ‘A’ section has 47, ‘B’ section has
42 and ‘C’ section has 46 students. If you add the number of students of all
these sections you will get 135(47+42+46). If you divide this by 3 (number of
sections), you get 45(=135/3). This number (=45) is what teachers mean by
average number of students in a class in their school. Similarly you can arrive
at the average number of students in a class for the entire school (considering
all sections of all standards). If there is only one section and the section
has 40 students, then average and class strength are one and the same.
We
have seen in statistics that the individual figures (47,42,46) are called
scores and the number 3 (no of sections in this case ) is called Number of
scores.
5.3 Example 2: You
must have heard your parents saying that you have scored an average of 68 marks
in an examination. Since you have several subjects, it is difficult to remember
the marks in each of the subjects. Because, it is easy to remember one number,
people express the marks as average. Let the marks scored be: English: 65,
Hindi: 60, Social Science: 65, General science: 70, Mathematics: 80.If you add
all the marks, you get 340. Since there are 5 subjects we divide the total
marks by this number to get 68. This is the average marks you have got. In this
method you must have observed that the average does not reflect your highest
marks(got in mathematics) or lowest marks(got in Hindi).
Note: As it can be seen from the above
example, expressing average figure could be misleading in some cases. But it is
very useful in many cases particularly when we have large number of scores (Ex:
average rain fall in a place, average height of students in a class, etc).
5.3 Example 3: Let your favorite cricketer score the following runs in
few one day matches
27,45,40,18,80,55, 47,105,46,
40,47. What is his average?
Workings:
Total runs scored =
27+45+40+18+80+55+ 47+105+46+40+47=550
Number of matches played = 11
Average Runs per match = 550/11=50
Average can be calculated by
applying the following formula:
Definitions:
‘Mean’ = Sum of all scores/Number of
Scores
Let x1,x2,x3,x4 ….xn be scores( thus there are
‘n’ number of scores)
Then Average = (x1+x2+x3+x4 ….+xn)/n
Mean = (![]() )/Number of scores
)/Number of scores
The symbol ![]() is pronounced as sigma and is used to represent the sum of
numbers.
is pronounced as sigma and is used to represent the sum of
numbers.
The mean is also called average’ or ‘Arithmetic
mean’.
Let us learn few more concepts in
statistics.
Let us arrange the runs of Example
5.3.3 in ascending order. Then the runs are
18,27,40,40,45,46,47,47,55,80,105.
Middle figure (6th out of
11) in this arrangement is 46
and is called Median.
The middle most figure in an
orderly distribution of scores is called ‘median’.
It is interesting to note that in
this Cricketer’s case, his Mean (Average) (50) and Median (46) are very close
to each other.
Let us find the most occurrences
of same number of runs scored, in case of this cricketer. We find that he
scored 40 runs and 47 runs two times each. They are called Mode.
The ‘Mode’
is the most often repeated score in a given set of scores.
In the above example the number of
matches was 11. Since 11 is an odd number, it is easy to find Median (middle figure). What if
we have even number of scores ?
5.3 Example 4: Let us take the case of temperatures recorded (in
centigrade) for 10 days at your place.
Let they be 250 C, 300 C, 310
C,340 C,320 C,310 C,300 C,280
C,300 C,310 C.
Working:
When we arrange them in ascending
order, we get
250C,280C,300
C,300 C,300 C,310 C,310 C,310
C,320 C,340 C.
Let us tabulate them in a table:
|
Scores (x) |
Occurrences (frequency)(f) |
fx=x*f |
|
250C |
1 |
25 |
|
280C |
1 |
28 |
|
300C |
3 |
90 |
|
310C |
3 |
93 |
|
320C |
1 |
32 |
|
340C |
1 |
34 |
|
Total( |
10 |
302 |
Average For ungrouped data (when
scores and frequency are given) can also be calculated by the formula
Average (mean) = (![]() )/ (
)/ (![]() )= 302/10 = 30.20C
)= 302/10 = 30.20C
Median is (30+31)/2 =30.50C
(Average of 5th and 6th term as there are even number of
scores which is 10)
Modes are 300C and 310C both of which occur three times
which is the most number of occurrences.
Note: In this Example there is not
much difference between Average (30.20C),Median (30.50C)
and Modes(300C,310C). When we have large number of data
(scores) we may notice Average, Median, and Mode being nearer to each other.
5.3 Problem 1: Mean of 9 observations was found to be 35. Later on it
was found that an observation 81 was misread as 18. Find the correct mean of
observations.
Solution:
Mean of 9 observations = 35
![]() Sum of all observations = 35*9 = 315
Sum of all observations = 35*9 = 315
In the observations 81 was misread as 18
The correct sum of all observations = 315-18+81 = 378
![]() The correct mean = 378/9 = 42
The correct mean = 378/9 = 42
5.3 Summary of learning
|
No |
Points to remember |
|
1 |
Mean=
(Sum of all scores)/Number of scores |
|
2 |
The middle most figure in an orderly distribution
of scores is called median |
|
3 |
Mode is the most often repeated score in a given
set of scores |
Additional Points:
5.3.2 Assumed mean method for calculation of mean.
This method is very useful when
data and their frequencies are very large. In this method we assume one of the
data to be mean and find the deviation from that number and hence this method
is called ‘assumed mean method’.
Let us take the example worked out earlier (5.3 Example 4) to
illustrate this method.
5.3 Example 4: Let us take the case of temperatures recorded (in
centigrade) for 10 days at your place.
Let they be 250C, 300C,
310C, 340C, 320C, 310C, 300C,
280C, 300C, 310C.
Let 30 be the assumed mean (any
score can be assumed to be the mean but we normally
take the score which is in the middle part of the distribution as assumed mean)
The Deviation D (D = Score-
Assumed mean) is calculated for each of the score.
Then Average (mean) = A + (![]() )/Number of scores
)/Number of scores
|
Scores (x) |
Frequency(f) |
Deviation D= A-M |
fD = f*D |
|
250C |
1 |
-5(=25-30) |
-5 |
|
280C |
1 |
-2(=28-30) |
-2 |
|
300C=A |
3 |
0(=30-30) |
0 |
|
310C |
3 |
1(=31-30) |
3 |
|
320C |
1 |
2(=32-30) |
2 |
|
340C |
1 |
4(=34-30) |
4 |
|
Total( |
10 |
|
2 |
Average (Mean) = A +(![]() )/Number
of scores = 30+ (2/10) = 30.2
)/Number
of scores = 30+ (2/10) = 30.2
Is this not the same mean
value which we got earlier?
This method is less time
consuming and hence less chances of one making mistakes.