7.5 Graphical method of solving a
Quadratic equations:
We have learnt how to draw graph for an equation of
type y=mx+c(Where m is a constant).
We have also observed that the equation of this
type represents a straight line.
Let us learn to solve quadratic equation of type ax2
+bx+ c =0
We can solve the equation by two methods
First method:
ax2 +bx+ c = 0
can be written as
ax2= -bx-c
Let each be equal to y
So we have two equations y = ax2 and y
=-bx-c
Draw the graph for both these equations. The
intersecting points of the two graphs are solutions to the given equation ax2
+bx+ c=0
Note that y = =bx-c is an
equation to a line. Problem 7.5.1 illustrates this method.
Second method:
Draw the graph ax2 +bx+
c and then find the points on the graph which touches x-axis (I.e. when
y=0).The x-co-ordinates of the points on the graph, whose y-co-ordinates are
zero, are roots of the
given equation. Problem 7.5.2 illustrates this method.
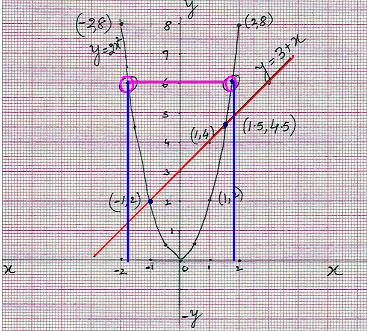
7.5 Problem 1: Draw the graph for
y=2x2 and y= 3+x and hence
1. Solve the equation 2x2-x-3=0
2. Find the value of ![]()
Solution:
1. Solving of equation 2x2-x-3=0
|
Step
1: For few values of x tabulate the values of y (=2x2)
as shown below:
Step
2: On a graph sheet mark the (x, y) co-ordinates. Join these points by a
smooth curve. This smooth curve is called ‘parabola’ Step
3: For two values of x tabulate the values of y
(=3+x) as shown below
Why did
we ask you to find coordinates for only 2 values of x? (y=3+x is of type y=mx+c
and it represents a straight line. To draw a straight line, two points are
enough) Step
4: On a graph sheet mark these two (x,y)
co-ordinates. Join these two points. The
parabola and the straight line cut each other at two points. They are (-1, 2)
and (1.5, 4.5). Their
x co-ordinates are -1 and 1.5 respectively. -1
and 3/2 satisfy the given equation 2x2-x-3=0. Verification: The given equation 2x2-x-3=0
is of the form ax2 +bx+ c =0. We have
learnt that the roots of this equation are The
roots are (1 |
|
|||||||||||||||||||||||||||
|
2. Finding value of We
need to find the value of y when x = We
notice that x co-ordinate of the parabola at y=6 are -1.7 and +1.7 which gives the value of |
||||||||||||||||||||||||||||
Exercise and observations:
1. Draw few graphs for the equation y =mx2
for few values of m (both +ve and –ve) and observe the following:
-
All graphs are parabolas and pass through the origin
-
They are all symmetric about y-axis.
2. Draw few graphs for the equation x =my2
for few values of m (both +ve and –ve) and observe the following:
-
All graphs are parabolas and pass through the origin
-
They are all symmetric about x- axis.
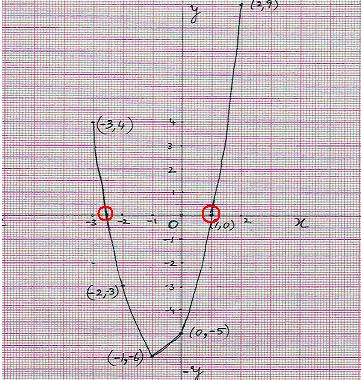
7.5 Problem 2: Solve the equation 2x2+3x-5=0
Solution:
|
Step
1: For few values of x tabulate the values of y(=2x2+3x-5) as
given below:
Step
2: On a graph sheet mark these (x, y) co-ordinates. Join
these points by a smooth curve. This smooth curve is a parabola. We
need to find the point on graph when 2x2+3x-5=0( i,e when y=0) We
notice that the graph touches the x axis (note that y=0 for any point on x
axis) at x=
-2.5(= -5/2) and at x=1. Therefore
1 and -5/2 are the roots of the given equation. Verification: The given equation
2x2+3x-5=0 is of the form ax2 +bx+
c =0 We have learnt that the roots of this
equation are
The
roots are (-3 I.e.
= 1 and -5/2 are the roots which we derived using the graphical method |
|
Exercise and observations:
Draw graphs for the following equations in both the
methods and observe the following
|
|
Equation
|
Method1 |
Method 2 |
Reason |
||
|
|
|
Draw 2 graphs |
Observations |
Draw 1 graph for |
Observations |
Determinant = b2-4ac = |
|
1 |
2x2+2x-15=0 |
y
= 2x2 y
= -2x+15 |
The
graphs meet at two points:(-5,0),(3,0) |
2x2+2x-15 |
The
graph touches x axis at 2 points and thus has two roots. |
4-60=64
= 82 (perfect
square) |
|
2 |
4x2-4x+1=0 |
y
= 4x2 y
= 4x-1 |
The
graphs meet at one point: (1/2,0) |
4x2-4x+1=0 |
The
graph touches x axis at 1 point and has
only one root |
16-16=0 (zero) |
|
3 |
x2-6x+10=0 |
y
= x2 y
= 6x-10 |
The
graphs do not meet at all! |
x2-6x+10=0 |
The
graph does not touch x axis and thus no roots. |
36-40
= -4 (negative) |
7.5 Summary of learning
|
No |
Points studied |
|
1 |
Quadratic
equations can be solved by drawing graphs |